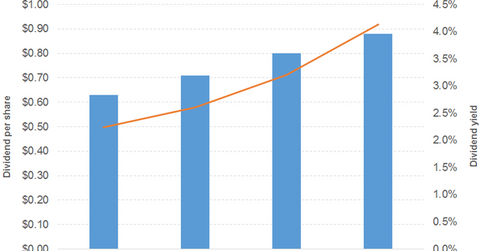
What’s Driving GGP’s Dividend Yield Upward
Revenue and earnings GGP (GGP), a retail REIT engaged in US real estate investment, saw its revenue fall 2% in 2016, compared with 5% in 2015. Growth was driven by management fees and other corporate revenue, and offset by minimum rent, tenant recoveries, and overage rent. Its operating expenses rose 4% in 2016 after a 7% […]
Sept. 18 2017, Published 11:16 a.m. ET

Revenue and earnings
GGP (GGP), a retail REIT engaged in US real estate investment, saw its revenue fall 2% in 2016, compared with 5% in 2015. Growth was driven by management fees and other corporate revenue, and offset by minimum rent, tenant recoveries, and overage rent.
Its operating expenses rose 4% in 2016 after a 7% fall in 2015. As a result, its operating income fell 13% in 2016 compared with 2% in 2015. Its interest expenses fell 13% in 2015 and 6% in 2016. In 2016, the company posted a gain on foreign currency, after two years of loss, and recorded some gains from changes in the control of investment properties. Collectively, these losses and gains translated into a 6% fall in its EPS (earnings per share) in 2016, after 107% EPS growth in 2015. The company’s FFO (funds from operations) grew in 2016 after a fall in 2015.
Revenue and EPS in 1H17
In 1H17, GGP’s revenue fell 5% due to a decline in its minimum rent, tenant recoveries, overage rent, management fees, and other corporate revenue. Its operating expenses fell 6%, its operating income fell 4%, and its interest expenses fell 10%. These declines, in addition to a loss from changes in the control of investment properties, translated into a 38% fall in its EPS. The company’s FFO rose 2%.
Dividend
The company has consistently increased its dividend, and it rose phenomenally between 1H16 and 1H17.
Stock prices
GGP stock has been beaten by the Direxion Daily Retail Bull 3X Shares ETF (RETL) since 2015. The Guggenheim S&P Equal Weight Financial ETF (RYF) has beaten the stock since the end of 2016.
The First Trust NASDAQ Rising Dividend Achievers ETF (RDVY) offers a dividend yield of 1.3%, at a PE (price-to-earnings) ratio of 15.7x. It has a 29%, 16%, and 6% exposure to the financial, consumer cyclical, and consumer non-cyclical spaces, respectively. The YieldShares High Income ETF (YYY) offers a dividend yield of 8.7%, at a PE ratio of 19.1x. It has a 30% exposure to financials.
