KKR Private Markets Segment Projects Deployment and Growth in 2017
KKR & Company’s (KKR) Private Markets segment contributed almost 71% of the company’s total revenues in 4Q16.
March 13 2017, Updated 7:36 a.m. ET

Fund performance
KKR & Company’s (KKR) Private Markets segment contributed almost 71% of the company’s total revenues in 4Q16. The segment’s performance largely affects the overall performance of the company.
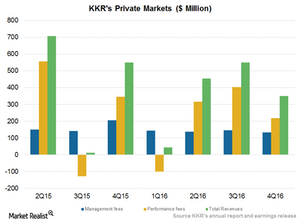
In 4Q16, the segment reported revenues of $351 million as compared to $550 million in 4Q15 and $549 million in 3Q16. Its private equity portfolio rose 3.4% YoY (year-over-year) in 4Q16 and 11.6% on a last-12-month basis (ending December 31, 2016).
The segment ended the quarter with AUM (assets under management) of $73.8 billion as compared to $75.2 billion in 3Q16 and $66.0 billion in 4Q15. The division saw new capital raises of $1.8 billion and appreciation of $1.3 billion, offset by distributions of $4.4 billion. Of the segment’s total AUM, fee-paying AUM stood at ~$52.2 billion, a rise of $8.2 billion from 3Q16. In 1Q17, KKR’s public portfolio is expected to rise mainly due to growth in broad markets. The company could see higher realizations on the back of improved liquidity.
KKR’s revenue fell 26% in 2016. KKR’s competitors’ revenue growth is as follows:
- BlackRock (BLK) fell 2.2%.
- Blackstone Group (BX) rose 10.3%.
- Apollo Global Management (APO) rose 89.2%.
Together, these companies make up 4.1% of the PowerShares Global Listed Private Equity ETF (PSP).
Public portfolios
The Private Markets segment’s total revenues fell in 4Q16 mainly due to higher unrealized losses of $285 million, translating into lower performance income of $219 million. The division also saw lower base fees of $132 million.
KKR announced deployments of $3 billion in 1Q17. The company deployed a total of $11 billion across the Americas, Asia, and Europe in 2016. The private equity component of the balance sheet makes up almost half of the company’s total balance sheet.
