A Look at Netflix’s Key Operational Metrics
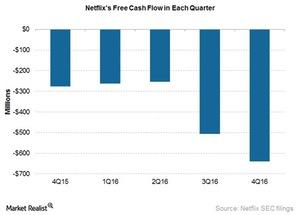
Netflix (NFLX) had free cash flow of -$639.0 million in 4Q16 compared to $276.0 million in 4Q15.
Jan. 26 2017, Updated 7:36 a.m. ET

Negative free cash flow
Netflix (NFLX) had free cash flow of -$639.0 million in 4Q16 compared to $276.0 million in 4Q15, as you can see in the graph below. In October 2016, the company raised its debt to about $1.0 billion and expects to raise it regularly to fund its investments in original content.
The company stated in its fiscal 4Q16 letter to its shareholders that it’s targeting an operating margin of 7.0% on a global basis for fiscal 2017. It also said in its fiscal 4Q16 earnings call that when it comes to operating costs in fiscal 2017, it expects to spend around $6.0 billion on content and $1.0 billion each on technology and development and administrative costs.
The reason Netflix is burning cash
Netflix’s (NFLX) increasing capital requirements are fueled by its increasing focus on original programming. The production of original programming requires more upfront cash than the acquisition of licensed content.
The company stated in its fiscal 4Q16 earnings call that it expects free cash flow of around -$2.0 billion in fiscal 1Q17. It expects free cash flow to improve after 1Q17. The company also said it expects to fund more of its content through operating profits in the future.
Netflix believes that producing its own original content gave the company global content rights, which will interest its investors and shareholders.
