A Look at Capacity Utilization across US Industries in November
In the November capacity utilization report, the manufacturing sector remained strong with 76.4% capacity utilization, the highest level since May 2008.
Dec. 22 2017, Updated 3:40 p.m. ET

Capacity utilization and the US economy
Capacity utilization of US industries and industrial production data are published by the Federal Reserve. Any changes to an industry’s business cycle can be predicted by observing the changes in capacity utilization. These changes can provide insight into the future demand of a business’s products and demand for labor. A change can help project changes to consumption and inflation (TIP). An increase in capacity utilization signals an increase in jobs and could also lead to capital spending by industries where capacity utilization has peaked.
Capacity utilization, as the name suggests, is the percentage of capacity utilized of the total potential output. The average capacity utilization for all industries from 1972–2016 is 79.9% in the United States. Durable goods manufacturing (XLU) and electrical equipment (VPU), appliances, and components have the highest average capacity utilization rate of 82.4%.
Capacity utilization in November
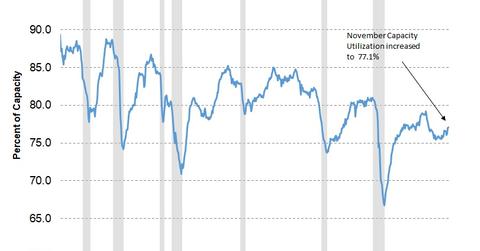
In the November capacity utilization report, the manufacturing sector remained strong with 76.4% capacity utilization, the highest level since May 2008. The mining (PICK) sector had a capacity utilization rate of 84.5%. The disappointment in this month’s report was the utilities sector, which fell 1.4% in capacity utilization.
Why investors need to track industrial production and capacity utilization data
Capacity utilization and industrial production are the most followed indicators used to understand the stage of a business cycle. Capacity utilization in industry has been consistently improving from the 2009 low of 66.7% and appears to be increasing in 2018. This forward indicator helps investors read any warning signs of an impending slowdown in the industry (XLI). The current readings, however, do not show any signs of a slowdown.
