What Does AbbVie’s Dividend Curve Look Like?
AbbVie (ABBV) recorded a 12.0% rise in net revenue for 2016, mainly driven by Humira and Imbruvica.
Aug. 16 2017, Published 9:38 a.m. ET
AbbVie: Healthcare sector, major drug manufacturers industry
AbbVie (ABBV) recorded a 12.0% rise in net revenue for 2016, mainly driven by Humira and Imbruvica, followed by Synthroid, Creon, and Duodopa. That was followed by an impressive growth in operating EPS (earnings per share) despite rising interest expenses. The company generates enough free cash flow to pay off its dividends. However, it has also increased its share repurchases substantially in the last two years. Its financial leverage is quite high. The same can be said for its debt-to-equity ratio.
We can see the growth trajectory of its dividend yield in the graph below. (Note that the asterisk in the graph denotes an approximation in calculating the dividend.)
Net revenue growth
AbbVie’s net revenue rose 9.0% in the first half of 2017, driven by the same drugs we mentioned above. Growth in its operating income followed by a lower increase in interest expense for 2016 and a lower foreign exchange loss contributed to an impressive EPS.
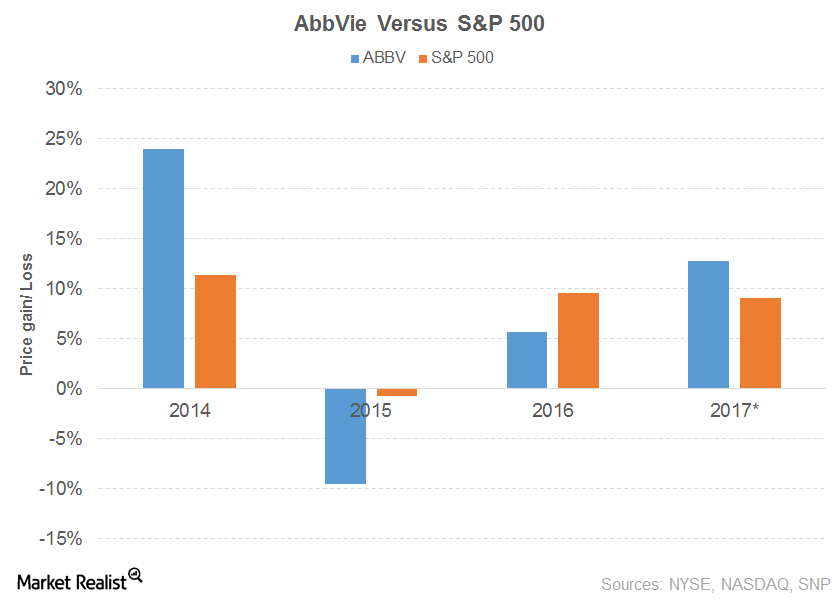
We can see in the above graph that the company has had everything going in its favor since 2016. (Note that the asterisk in the graph denotes a price gain or loss to date.) AbbVie has beaten the S&P 500 in terms of price gains. Its price movement has beaten peers such as Bristol-Myers Squibb (BMY), as shown in the graph below.
AbbVie stock has risen 13.2% on a YTD (year-to-date) basis.
AbbVie’s PE (price-to-earnings) ratio of 19.3x compares to a sector average of 43.6x. Its dividend yield of 3.6% is the sector average.
The FlexShares International Quality Dividend ETF (IQDF) offers a dividend yield of 3.6% at a PE ratio of 18.7x. It’s a diversified ETF with the highest exposure to financials. The WisdomTree Europe SmallCap Dividend ETF (DFE) offers a dividend yield of 2.7% at a PE ratio of 14.6x. It’s a diversified ETF with the highest exposure to industrials.