An Analysis of Vornado’s Shareholder Returns
Vornado Realty Trust (VNO) has been paying dividends to its shareholders consistently in every quarter since it became a public company in 1998.
Jul. 10 2017, Updated 7:36 a.m. ET

Why dividends matter
In order to function as real estate investment trusts (or REITs), commercial REITs like Vornado Realty Trust (VNO) need to pay 90% of their taxable income as dividends or share repurchases. This allows them to enjoy several tax benefits that other corporate entities don’t have.
REITs draw their funds for shareholder returns from their rental income. Rents provide a reliable and continuous source of income to these REITs.
Vornado Realty Trust, Boston Properties, and Equity Residential comprise ~12.4% of the iShares Cohen & Steers REIT ETF (ICF). ICF’s annual yield is ~3.9%.
Consistent dividend payment
Vornado Realty Trust (VNO) has been paying dividends to its shareholders consistently in every quarter since it became a public company in 1998. On January 18, 2017, the company announced a 12.7% hike in the quarterly dividend to $0.73 per share, resulting in an annualized dividend of $2.92 paid on February 15, 2017.
Vornado paid $475.9 million in dividends during 2016. The company paid a dividend of $2.52 per share for 2015 and 2016. During 2013 and 2014, the company paid a dividend of $2.92 per share. The decrease in the dividend paid during 2015 and 2016 reflects the disposition of Urban Edge Properties in January 2015.
The company paid a total dividend of $3.76 during 2012. The higher dividend reflects a special long-term capital gain dividend of $1.00 per share during the period.
The company has maintained a consistent dividend yield over the last two years. The company’s dividend yield was ~2.5% in 2015 and ~2.4% in 2016. Analysts expect Vornado to maintain dividend yields of ~2.9%, ~3.0%, and ~3.1% for 2017, 2018, and 2019, respectively. For the next 12 months (or NTM), the company is expected to maintain a dividend yield of $2.92.
FFO payout ratio
The FFO (funds from operations) payout ratio is calculated as the ratio between the dividends paid per share and FFO per share for a given period. This gives an idea about a company’s shareholder returns in a given period, and it implies the dividend amounts the company distributes from its FFO.
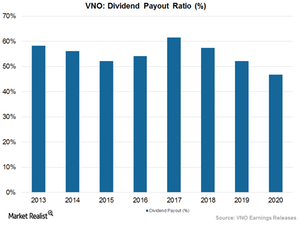
VNO’s FFO payout ratio was 62.8% in 1Q17. The company’s expected payout ratios in the next three quarters are 61.7%, 59.7%, and 59.2% for 2Q17, 3Q17, and 4Q17, respectively. The chart above shows the estimated dividend payout trend for the next four years.
Peer group
If we consider other REITs by comparing FFO payout ratios, we find that the payout ratio of VNO was in line with its competitors. AvalonBay Communities (AVB) has a payout ratio of 65%, Lexington Realty (LXP) has a payout ratio of 61%, and Simon Property Group (SPG) has a payout ratio of 60%.
In the next article, we’ll find out how Vornado Realty Trust performs in terms of leveraging its debt level.
