Natural Gas Inventories Spread: Savior for Natural Gas Bulls?
The EIA reported that natural gas inventories rose by 78 Bcf (billion cubic feet) to 2,709 Bcf in the week ending June 9, 2017.
Jun. 22 2017, Published 1:31 p.m. ET

Natural gas inventories
The EIA (U.S. Energy Information Administration) released its Weekly Natural Gas Storage report for the week ending June 9, 2017, on June 15, 2017. Natural gas inventories rose by 78 Bcf (billion cubic feet) to 2,709 Bcf in the week ending June 9, 2017.
Natural gas inventories spread
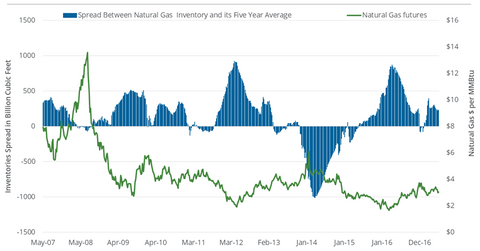
In the last ten years, natural gas prices moved inversely of the natural gas inventories spread—the difference between natural gas inventories and their five-year average. In fact, the higher natural gas inventories spread has been followed by lower natural gas prices since 2008.
In the winter season that ended in March 2014, natural gas inventories fell 54.6% below their five-year average. The reversal in the spread pushed natural gas (GASL) active futures to $6.15 per million British thermal units—a multi-year high closing price.
The analysis could impact energy ETFs like the iShares US Energy ETF (IYE), the Vanguard Energy ETF (VDE), the ProShares Ultra Oil & Gas ETF (DIG), the Direxion Daily S&P Oil & Gas Exploration & Production Bear 3x ETF (DRIP), and the SPDR S&P Oil & Gas Exploration & Production ETF (XOP).
Recent moves in the natural gas inventories spread
In the week ending January 27, 2017, natural gas inventories were above their five-year average. Between January 27, 2017, and June 21, 2017, natural gas active futures fell 14.7%.
Based on the latest data, natural gas inventories were 9.2% above their five-year average. The previous week, inventories were 9.8% above their five-year average. So, the spread fell in the week ending June 9, 2017. The EIA released its Weekly Natural Gas Storage report for the week ending June 9, 2017, on June 15, 2017. Between June 15, 2017, and June 21, 2017, natural gas active futures fell 5.5%. So, current weather-related bearish factors outweighed the small bullish move in the inventory spread.
Inventories at 10.6% below the previous year’s level could help limit the fall in natural gas prices.
EIA data and market forecast
The EIA’s Weekly Natural Gas Storage report for the week ending June 16, 2017, will be released on June 22, 2017. Analysts’ forecast indicates a rise of 55 Bcf in natural gas inventories.
