Under Armour Announces a Change in Its Ticker Symbols
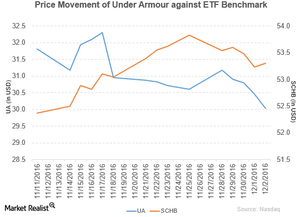
Under Armour (UA) fell 1.9% to close at $30.03 per share during the fifth week of November 2016.
Dec. 6 2016, Updated 8:07 a.m. ET

Price movement
Under Armour (UA) fell 1.9% to close at $30.03 per share during the fifth week of November 2016. The stock’s weekly, monthly, and year-to-date (or YTD) price movements were -1.9%, -2.5%, and -25.5%, respectively, as of December 2, 2016.
UA is trading 3.7% below its 20-day moving average, 13.1% below its 50-day moving average, and 23.0% below its 200-day moving average.
Related ETF and peers
The Schwab US Broad Market ETF (SCHB) invests 0.05% of its holdings in Under Armour. The YTD price movement of SCHB was 9.6% on December 2.
The market caps of Under Armour’s competitors are as follows:
Latest news on Under Armour
In a press release on November 28, 2016, Under Armour reported, “Under Armour, Inc. (UA, UA.C) today announced that it will change the ticker symbols of its Class A Common Stock and Class C Common Stock, each listed on the New York Stock Exchange. The ticker symbol for the Company’s Class A Common Stock will change from ‘UA’ to ‘UAA’. The ticker symbol for the Company’s Class C Common Stock will change from ‘UA.C’ to ‘UA’. The changes will become effective at the start of trading on December 7, 2016.”
Performance of Under Armour in 3Q16
Under Armour reported 3Q16 net revenues of $1.5 billion, a rise of 22.2% compared to $1.2 billion in 3Q15. The company’s gross profit margin and operating margin fell 130 basis points and 70 basis points, respectively, in 3Q16 compared to the prior year’s period.
The gross profit margin fell due to the impact of an unfavorable foreign exchange, an increase in promotions, and the timing of liquidation, partially offset by the margin improvement in product costs.
Its net income, EPS (earnings per share) of Class A and Class B, and EPS of Class C common stock rose to $128.2 million, $0.29, and $0.29, respectively, in 3Q16. Those figures compare to $100.5 million, $0.23, and $0.23, respectively, in 3Q15.
Under Armour’s cash and cash equivalents and inventories rose 12.9% and 11.9%, respectively, in 3Q16 compared to 3Q15.
Projections
Under Armour has made the following projections for fiscal 2016:
- net revenues: ~$4.9 billion
- operating income: $440.0 million–$445.0 million
- interest expense: ~$30.0 million
- effective tax rate: ~35.5%
- fully diluted weighted average shares outstanding of ~446.0 million
Now we’ll take a look at Thor Industries (THO).
