Ray Dalio: ‘Risks Are Asymmetric on the Downside’
“Risks are asymmetric on the downside” On the economy, Ray Dalio stated that “the risks are asymmetric on the downside, because asset prices are comparatively high at the same time there’s not an ability to ease.” Courtesy of the current global monetary policy’s low interest rates, asset prices are artificially inflated—so much so that they’ve […]
Nov. 22 2019, Updated 6:24 a.m. ET

“Risks are asymmetric on the downside”
On the economy, Ray Dalio stated that “the risks are asymmetric on the downside, because asset prices are comparatively high at the same time there’s not an ability to ease.”
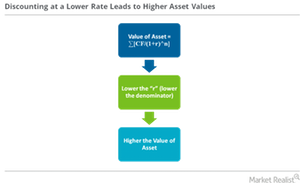
Courtesy of the current global monetary policy’s low interest rates, asset prices are artificially inflated—so much so that they’ve begun to hint at a bubble. Since most asset prices are a function of future expected cash flow discounted to the present using the current interest rates (which are zero bound), prices have been elevated to levels that do not seem sustainable. Moreover, the Fed’s ability to do anything about it has diminished due to the reduced efficacy of monetary policy tools.
Dalio identified lack of spending as a key risk
Back in April, Ray Dalio stated that the lack of spending presented the largest risk of creating a recession in the United States (SDS) (TZA) (SQQQ). In his economic principles template, Dalio has identified spending as the driving force behind any economy. As uncertainty continues to impact markets, companies are getting more and more defensive about their business spending as corporate profitability on a per-private-worker basis is declining.
Warning signs in profitability and GDP growth
Investment baron Jeffrey Gundlach of DoubleLine Capital also sees corporate profitability as an economic indicator. At a conference, he presented a chart he called “the most bearish chart for the U.S. economy.” In the chart, he identified dips in the S&P 500’s (IVV) (SPY) (VOO) return and earnings growth as a sign of trouble brewing. Recently, Gundlach presented another chart, which he called an “early warning indicator” of a recession. In the chart, which compared the U3 unemployment rate[1. the official unemployment rate] against its 12-month moving average, Gundlach showed that when the unemployment rate surpasses its 12-month moving average, the United States experiences a recession. Furthermore, the US nominal GDP seems to be signaling a recession.
