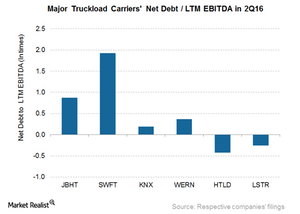
Which Truckload Carrier Posted the Most Debt in 2Q16?
Landstar System (LSTR) and Heartland Express (HTLD) have higher available cash on their balance sheets than total debt.
Sep. 13 2016, Updated 4:04 p.m. ET

Truckload carriers’ leverages
In the previous part of the series, we looked at our truckload carriers’ second-quarter 2016 earnings. Now we’ll assess their debt levels and ability to service these debt levels. It’s worth noting that we’ve taken the net debt of these companies. It’s calculated by deducting the available cash from the total debt.
EBITDA (earnings before interest, tax, depreciation, and amortization) is the earnings from core business operations. EBITDA is used mainly to eliminate the differences between companies’ capital structures and taxation practices.
Net debt-to-LTM EBITDA multiple
The net debt-to-LTM (last 12-month) EBITDA multiple is a leverage ratio that shows the number of years a company needs to pay back its debt by assuming a constant net debt and LTM EBITDA. This ratio reflects a company’s ability to reduce its total debt.
The trucking industry’s capital spending is low compared to railroads (UNP). Railroads have to lay down tracks at their own cost, while truckers don’t have to spend anything on road infrastructure, which is essentially a federal or state domain.
Companies with higher debt levels during industry upturns tend to perform better than their low-debt-level peers. However, with business slowing down, these companies do feel the heat of a higher interest expense unsupported by growth in their top lines.
As you can see in the above graph, Landstar System (LSTR) and Heartland Express (HTLD) have higher available cash on their balance sheets than total debt. So their net debt-to-LTM EBITDA ratio is negative. Among the remaining truckload carriers, Swift Transportation (SWFT) and JB Hunt Transport Services (JBHT) have high levels of net debt-to-EBITDA of 1.9x and 0.9x, respectively.
SWFT’s ratio is more than double that of JBHT’s. This can be a matter of concern for SWFT investors. Trucking companies such as SWFT have indulged in the disposal of core assets in the wake of lower freight volumes. SWFT voluntarily prepaid its Term Loan A of $43.8 million in the second quarter of 2016 to reduce interest expenses.
ETF investments
Major US airlines (DAL) and railroads make up 6.5% and 4.0%, respectively, of the iShares Global Industrials (EXI). EXI holds 1.1% and 2.1%, respectively, in global express delivery companies FedEx (FDX) and United Parcel Service (UPS).
In the next part, we’ll take a look at the cash flows of these truckload carriers.
