Visteon Appoints Christian A. Garcia as Executive Vice President
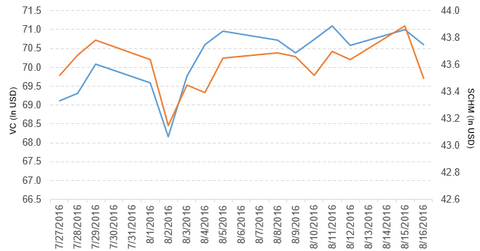
Visteon (VC) has a market cap of $2.4 billion. It fell by 0.55% to close at $70.61 per share on August 16, 2016.
Aug. 17 2016, Published 3:50 p.m. ET

Price movement
Visteon (VC) has a market cap of $2.4 billion. It fell by 0.55% to close at $70.61 per share on August 16, 2016. The stock’s weekly, monthly, and year-to-date (or YTD) price movements were 0.31%, 4.3%, and -38.3%, respectively, on the same day. VC is trading 1.5% above its 20-day moving average, 1.6% above its 50-day moving average, and 16.1% below its 200-day moving average.
Related ETFs and peers
The Schwab US Mid-Cap ETF (SCHM) invests 0.10% of its holdings in Visteon. The ETF tracks a market-cap-weighted index of mid-cap stocks in the Dow Jones US Total Stock Market Index. The YTD price movement of SCHM was 9.3% on August 16.
The iShares Dow Jones US ETF (IYY) invests 0.01% of its holdings in Visteon. The ETF tracks a broad, cap-weighted index of companies covering 95% of the US market.
The market caps of Visteon’s competitors are as follows:
Visteon makes key appointment
Christian A. Garcia has been appointed Visteon’s executive vice president and chief financial officer, effective October 1. Garcia will report to Sachin Lawande, Visteon’s president and CEO, and will oversee accounting, treasury, tax, audit, investor relations, merger, acquisition, divestiture, and information technology activities.
Performance of Visteon in 2Q16
Visteon reported 2Q16 sales of $773.0 million, a fall of 4.8% from the sales of $812.0 million in 2Q15. The company’s gross profit margin rose by 15.7% between 2Q15 and 2Q16.
Its net income and EPS (earnings per share) fell to $26.0 million and $0.76, respectively, in 2Q16, compared with $2.2 billion and $49.73, respectively, in 2Q15. It reported adjusted EBITDA (earnings before interest, tax, depreciation, and amortization) and adjusted EPS of $77.0 million and $1.22, respectively, in 2Q16, a rise of 28.3% and 221.1% from 2Q15.
VC’s cash and equivalents and trade receivables fell by 69.0% and 3.8%, respectively, between 4Q15 and 2Q16. Its current ratio rose to 2.0x and its debt-to-equity ratio fell to 2.1x in 2Q16, compared with 1.5x and 2.9x, respectively, in 4Q15. It reported adjusted free cash flow of $79 in 2Q16, a rise of 139.4% over 2Q15.
Projections
The company has made the following projections for the Electronics Product Group in fiscal 2016:
- sales in the range of $3.1 billion to $3.2 billion
- adjusted EBITDA in the range of $305 million to $335 million
- adjusted free cash flow in the range of $110 million to $150 million
In the next part, we’ll look at Pinnacle Foods.
