A Look at Newell Brands’ Performance in 2Q16
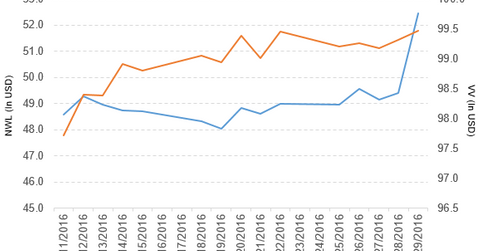
Newell Brands (NWL) has a market capitalization of $25.6 billion. It rose by 6.2% to close at $52.46 per share on July 29, 2016.
Aug. 1 2016, Published 4:42 p.m. ET

Price movement
Newell Brands (NWL) has a market capitalization of $25.6 billion. It rose by 6.2% to close at $52.46 per share on July 29, 2016.
The stock’s weekly, monthly, and year-to-date (or YTD) price movements were 7.1%, 9.7%, and 20.1%, respectively, on the same day. NWL is trading 7.7% above its 20-day moving average, 8.8% above its 50-day moving average, and 20.2% above its 200-day moving average.
Related ETF and peers
The Vanguard Large-Cap ETF (VV) invests 0.12% of its holdings in Newell Brands. The ETF tracks a market cap–weighted index that covers 85% of the market capitalization of the US equity market. The YTD price movement of VV was 7.4% on July 29.
The market capitalizations of Newell Brands’ competitors are as follows:
Performance of Newell Brands in 2Q16
Newell Brands reported 2Q16 net sales of $3.9 billion, a rise of 143.8% compared to net sales of $1.6 billion in 2Q15. Sales of its writing and its baby and parenting segments rose by 15.8% and 12.4%, respectively. Sales of its home solutions, tools, and commercial products segments fell by 1.1%, 3.8%, and 7.9%, respectively, in 2Q16 compared to 2Q15.
NWL also reported a loss related to the extinguishing of its debt-credit facility of $1.2 million in 2Q16. The company’s gross profit margin and operating income fell by 28.6% and 35.9%, respectively, in 2Q16 compared to the prior year’s period.
Its net income and EPS (earnings per share) fell to $135.2 million and $0.30, respectively, in 2Q16 compared to $148.5 million and $0.55, respectively, in 2Q15. It reported non-GAAP (generally accepted accounting principles) normalized EPS of $0.78 in 2Q16, a rise of 21.9% compared to 2Q15.
NWL reported cash and cash equivalents and inventories of $627.3 million and $2.9 billion, respectively, in 2Q16 compared to $238.7 million and $935.6 million, respectively, in 2Q15. Its current ratio rose to 1.6x, and its long-term debt-to-equity ratio fell to 1.1x in 2Q16 compared to a current ratio and a long-term debt-to-equity ratio of 1.1x and 1.2x, respectively, in 2Q15.
Projections
The company recently reported, “Core sales exclude the impact of foreign currency, all acquisitions (other than the Jarden acquisition) until their first anniversary and all planned and completed divestitures (which includes the deconsolidation of Venezuela). Core sales include the negative impact of planned product line exits.”
The company has reaffirmed the following projections for 2016:
- core sales growth in the range of 3.0%–4.0%
- normalized EPS in the range of $2.75–$2.90
- an effective tax rate in the range of 29%–30%
Next, we’ll discuss Tenneco.
