Kellogg Company Has Declared a Quarterly Dividend
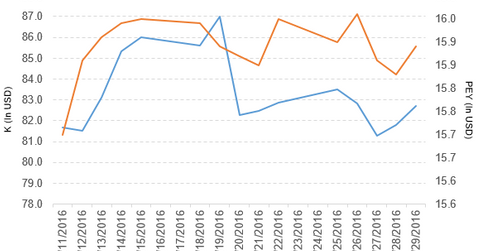
Kellogg Company (K) has a market capitalization of $28.8 billion. It rose by 1.1% to close at $82.71 per share on July 29, 2016.
Aug. 1 2016, Published 4:41 p.m. ET

Price movement
Kellogg Company (K) has a market capitalization of $28.8 billion. It rose by 1.1% to close at $82.71 per share on July 29, 2016.
The stock’s weekly, monthly, and year-to-date (or YTD) price movements were -0.18%, 6.6%, and 16.0%, respectively, on the same day. K is trading 0.36% below its 20-day moving average, 5.1% above its 50-day moving average, and 12.3% above its 200-day moving average.
Related ETF and peers
The PowerShares High Yield Equity Dividend Achievers Portfolio ETF (PEY) invests 1.7% of its holdings in Kellogg. The ETF aims to tracks a yield-weighted index of those US companies that have increased their annual dividends for at least ten consecutive years. The YTD price movement of PEY was 21.5% on July 29.
The market capitalizations of Kellogg’s competitors are as follows:
Kellogg declared a dividend
Kellogg Company has declared a regular dividend of $0.52 per share on its common stock. The dividend will be paid on September 15, 2016, to shareholders of record at the close of business on September 1, 2016.
Kellogg’s rating
Deutsche Bank has increased its price target for Kellogg Company to $78 from $74 per share. It has also maintained its “hold” rating on the stock.
TheStreet Ratings rated the stock as a “buy” with a score of B+.
Performance in 1Q16
Kellogg reported 1Q16 net sales of $3.4 billion, a fall of 4.5% compared to net sales of $3.6 billion in 1Q15. Sales fell in the following segments in 1Q16:
- US Morning Foods fell by 1.2%.
- US Snacks fell by 2.6%.
- North America and Other fell by 4.4%.
- Europe fell by 1.5%.
- Latin America fell by 34.9%.
- Asia Pacific fell by 6.1%.
Sales from the US Specialty segment rose by 4.2% in 1Q16 compared to 1Q15. The company’s cost of goods sold as a percentage of net sales fell by 3.1%. Its operating profit rose by 14.1% in 1Q16 compared to 1Q15.
Its net income and EPS (earnings per share) fell to $1.8 billion and $0.49, respectively, in 1Q16. That compares to $2.3 billion and $0.64, respectively, in 1Q15.
Kellogg’s cash and cash equivalents rose by 23.5%, and its inventories fell by 4.2% in 1Q16 compared to 4Q15. Its current ratio and long-term debt-to-equity ratio rose to 0.62x and 3.1x, respectively, in 1Q16, compared to 0.56x and 2.5x, respectively, in 4Q15.
Projections
Kellogg made the following projections for 2016:
- It expects currency-neutral comparable EPS of $4.00–$4.07. This projection includes the impact of currency translation of $3.64–$3.71 per share.
- The company expects currency-neutral comparable operating profit growth of 11%–13% due to the timing of price actions in the Venezuela business.
- It expects currency-neutral comparable net sales growth of 4%–6%. This projection excludes the 0%–2% impact of the Venezuela business.
- The company expects its cash flow to be ~$1.1 billion.
- It expects its capital expenditure to be 4%–5% of sales. This projection includes the impact of the cash required by Project K and an increase in capital spending of ~1% of sales to support the Pringles business.
Next, we’ll take a look at Colgate-Palmolive (CL).
