Johnson Controls Settles Its Bribe Charges
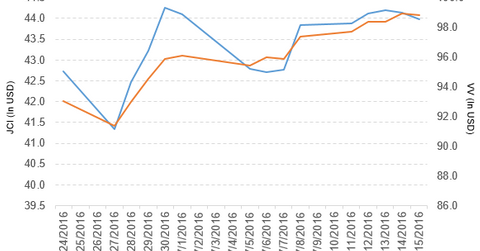
Johnson Controls (JCI) rose by 0.32% to close at $43.98 per share during the second week of July 2016.
Nov. 20 2020, Updated 11:01 a.m. ET

Price movement
Johnson Controls (JCI) rose by 0.32% to close at $43.98 per share during the second week of July 2016. The stock’s weekly, monthly, and year-to-date (or YTD) price movements were 0.32%, -0.36%, and 13.0%, respectively, as of July 15. JCI is trading 0.75% above its 20-day moving average, 1.8% above its 50-day moving average, and 9.1% above its 200-day moving average.
Related ETF and peers
The Vanguard Large-Cap ETF (VV) invests 0.15% of its holdings in Johnson Controls. The ETF tracks a market-cap-weighted index that covers 85% of the market capitalization of the US equity market. The YTD price movement of VV was 6.7% on July 15.
The market caps of Johnson Controls’ competitors are as follows:
Latest news on Johnson Controls
In a press release on July 11, 2016, Reuters reported, “Johnson Controls (JCI) agreed to pay $14.4 million to settle US regulatory charges that its workers bribed Chinese shipbuilders and shipyards, including some owned by the Chinese government, to win business and enrich themselves.”
The company also added, “Separately, the US Department of Justice said it declined to bring related criminal charges, in part reflecting Johnson Controls’ decision to voluntarily report the misconduct.”
Performance in fiscal 2Q16
Johnson Controls reported fiscal 2Q16 net sales of $9.0 billion, a decline of 1.8% compared to net sales of $9.2 billion in fiscal 2Q15. The company’s cost of sales as a percentage of net sales and income from continuing operations before income taxes fell by 2.4% and 34.7%, respectively, in fiscal 2Q16 compared to the same period last year. It reported restructuring and impairment costs of $2.3 billion in fiscal 2Q16.
Its net income and EPS (earnings per share) fell to -$5.3 billion and -$0.82, respectively, in fiscal 2Q16. That compares to $5.3 billion and $0.80, respectively, in fiscal 2Q15.
Johnson Controls’ cash and cash equivalents fell by 40.0%, and its inventories rose by 22.9% in fiscal 2Q16 compared to fiscal 4Q15. Its current ratio fell to 0.94x in fiscal 2Q16 compared to 1.0x in fiscal 4Q15.
Projections
The company has made the following projections:
- EPS of $3.85–$4 per share for fiscal 2016
- an effective tax rate of 17% for fiscal 2016
- EPS of $1.01–$1.04 for fiscal 3Q16
- repurchase $5.0 billion worth of shares before the end of fiscal 2016
This guidance doesn’t include transaction, integration, separation costs, and other non-recurring items.
For an ongoing analysis of this sector, please visit Market Realist’s Consumer Discretionary page.
