Why Did Honda Motor’s Stock Rise ~3% on July 11?
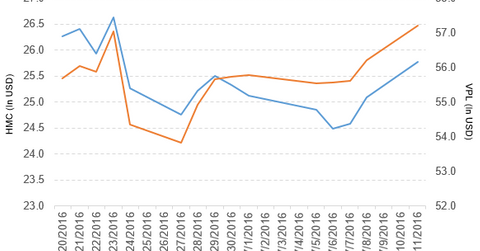
Honda Motor (HMC) has a market cap of $45.2 billion. It rose by 2.8% to close at $25.78 per share on July 11, 2016.
Jul. 12 2016, Published 2:42 p.m. ET

Price movement
Honda Motor (HMC) has a market cap of $45.2 billion. It rose by 2.8% to close at $25.78 per share on July 11, 2016. The stock’s weekly, monthly, and year-to-date (or YTD) price movements were 2.6%, -4.1%, and -19.3%, respectively, that day. HMC is trading 0.84% above its 20-day moving average, 2.8% below its 50-day moving average, and 10.8% below its 200-day moving average.
Related ETF and peers
The Vanguard FTSE Pacific ETF (VPL) invests 1.1% of its holdings in Honda Motor. The ETF tracks the FTSE Developed Asia Pacific Index, a market-cap-weighted index of securities in the developed markets of the Pacific region. The YTD price movement of VPL was 2.0% on July 11.
The market caps of Honda Motor’s competitors are as follows:
Latest news on Honda Motor
On July 11, 2016, Reuters reported that Honda Motor “said it had co-developed the world’s first electric motor for hybrid cars that uses no heavy rare earth metals, a breakthrough that would trim costs and reduce its dependence on the expensive materials controlled mainly by China.”
It also stated that “Japan’s third-largest automaker said on Tuesday the technology, developed with Daido Steel Co, will be used in the next Freed minivan to be unveiled this autumn.” It added that “Hybrid vehicles, which combine a gasoline engine and electric motor for better mileage, have gone mainstream in many developed countries but procuring a steady supply of rare earth elements such as dysprosium and terbium has been a challenge.”
Honda’s performance in fiscal 4Q16 and fiscal 2016
Honda reported fiscal 4Q16 sales revenue of 3.7 trillion Japanese yen, a rise of 4.8% over the sales revenue of 3.5 trillion yen in fiscal 4Q15. Between fiscals 4Q15 and 4Q16, sales revenue for its motorcycle business fell by 15.0% and sales revenue from it power products and other businesses fell by 5.5%. Sales revenue for its automobile business and financial services business rose by 9.5% and 1.4%, respectively. In fiscal 4Q16, HMC’s net income and EPS (earnings per share) fell to -79.0 billion yen and -51.9 yen, respectively, compared with 93.3 billion yen and 45.5 yen in fiscal 4Q15.
Fiscal 2016 results
In fiscal 2016, HMC reported sales revenue of 14.6 trillion yen, a rise of 9.6% YoY (year-over-year). Its net income and EPS fell to 406.4 billion yen and 191.2 yen, respectively, in fiscal 2016, compared with 561.1 billion yen and 282.7 yen in fiscal 2015.
The company’s cash and cash equivalents rose by 19.4% and its inventories fell by 12.3% in fiscal 2016. Its current ratio fell to 1.1x and its debt-to-equity ratio rose to 1.6x in fiscal 2016, compared with 1.2x and 1.5x, respectively, in fiscal 2015.
Projections
Honda has made the following projections for fiscal 2017:
- sales revenue of 13.8 trillion yen
- operating profit of 600.0 billion yen
- profit before income tax of 705.0 billion yen
- profit of 390.0 billion yen
- EPS of 216.4 yen
In the next part of this series, we’ll look at Canon.
