ExxonMobil’s Segmental Analysis: Pre-earnings Review
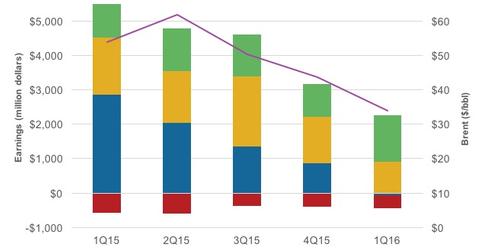
Changing oil prices have altered segment dynamics for ExxonMobil (XOM). Earnings from the company’s upstream segment have fallen steeply.
Nov. 20 2020, Updated 10:58 a.m. ET

Segmental analysis
Changing oil prices have altered segment dynamics for ExxonMobil (XOM). Earnings from the company’s upstream segment have fallen steeply. The segment contributed 58% of its total earnings in 1Q15. In 1Q16, it has turned into a loss-making segment.
ExxonMobil’s earnings from its downstream segment fell due to lower margins, partly offset by favorable volume and mix effects. The earnings fell 46% over 1Q15 to $0.91 billion in 1Q16. ExxonMobil’s chemical segment’s earnings rose 38% over 1Q15 to $1.4 billion in 1Q16.
While overall earnings fell from $4.9 billion in 1Q15 to $1.8 billion in 1Q16, the downstream and chemical segments resisted the fall.
ExxonMobil’s peers such as Petrobras (PBR), Chevron (CVX), and BP (BP) reported losses in their upstream segments in 1Q16. The PowerShares Dynamic Large Cap Value ETF (PWV) has ~5% exposure to energy sector stocks.
Segmental outlook for 2Q16
In 2Q16, ExxonMobil will likely witness a rise in its upstream and downstream earnings. WTI (West Texas Intermediate) and Brent prices averaged $34 per barrel and $35 per barrel in 1Q16. They rose to $46 per barrel and $47 per barrel, respectively, in 2Q16. This surge suggests a likely rise in the company’s upstream earnings.
Also, an important update in the segment is ExxonMobil’s bid for InterOil (IOC). According to various media reports, ExxonMobil has bid 10% higher than Oil Search’s $2.2 billion for InterOil. InterOil is an oil and gas exploration and production firm in Papua, New Guinea. Read Total, Oil Search, and InterOil: What’s the Deal? for more on Oil Search’s bid.
ExxonMobil’s earnings from the downstream segment will likely be better because the cracks have widened in 2Q16—compared to 1Q16. A point in case is the broader market crack indicator, the US Gulf Coast WTI 3-2-1 crack. It has risen from $8.9 per barrel in 1Q16 to $11.3 per barrel in 2Q16.
