Why Did The Coca-Cola Company Fall on June 17?
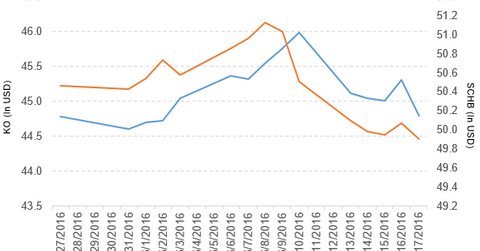
The Coca-Cola Company (KO) has a market cap of $192.8 billion. It fell by 1.2% to close at $44.79 per share on June 17, 2016.
Jun. 21 2016, Updated 9:07 a.m. ET

Price movement
The Coca-Cola Company (KO) has a market cap of $192.8 billion. It fell by 1.2% to close at $44.79 per share on June 17, 2016. The stock’s weekly, monthly, and YTD (year-to-date) price movements were -1.9%, 1.5%, and 5.9%, respectively, that day. This means that KO is trading 0.37% above its 20-day moving average, 0.15% below its 50-day moving average, and 5.3% above its 200-day moving average.
Related ETFs and peers
The Schwab US Broad Market ETF (SCHB) invests 0.75% of its holdings in Coca-Cola. The ETF tracks a cap-weighted index that measures the largest 2,500 stocks in the United States. The YTD price movement of SCHB was 1.8% on June 17, 2016.
The Vanguard Consumer Staples ETF (VDC) invests 8.1% of its holdings in Coca-Cola. The ETF tracks a market-cap-weighted index of stocks in the US consumer staples sector.
The market caps of Coca-Cola’s competitors are as follows:
Philadelphia city issues soda tax
On June 17, 2016, Coca-Cola Company fell by 1.2% after Philadelphia’s city council issued a soda tax of 1.5 cents per ounce on sweetened beverages. The city becomes the largest and second US city to pass the tax.
Coca-Cola’s performance in 1Q16
In 1Q16, Coca-Cola reported net operating revenues of $10.3 billion, a fall of 4.0% from the net operating revenues of $10.7 billion in 1Q15. The company’s gross profit margin and operating income fell by 2.1% and 6.8%, respectively, between 1Q15 and 1Q16.
In 1Q16, its net income and EPS (earnings per share) fell to $1.5 billion and $0.34, respectively, from $1.6 billion and $0.35, respectively, in 1Q15.
Between 4Q15 and 1Q16, KO’s total cash, cash equivalents, and its short-term investments rose by 20% and inventories rose by 5.2%. In 1Q16, its current ratio and long-term debt-to-equity ratio fell to 1.18x and 1.07x, respectively, compared with 1.24x and 1.1x, respectively, in 4Q15.
Projections
The company has made the following projections for fiscal 2016:
- organic revenue growth in the range of 4%–5%
- comparable currency-neutral income before taxes will grow by 6%–8%
- comparable currency-neutral EPS growth in the range of 4%– 6%
- effective tax rate of 22.5%
- it expects to repurchase shares worth $2.0 billion–$2.5 billion
The company has updated the impact of acquisitions, divestitures, and other structural items on second-quarter results due to the formation of Coca-Cola European Partners. It expects a four- to five-point headwind on income before taxes and a five- to six-point headwind on net revenues in 2Q16. Let’s take a look at Dr Pepper Snapple Group.
