What Is NOV’s Valuation Compared to Its Peers’?
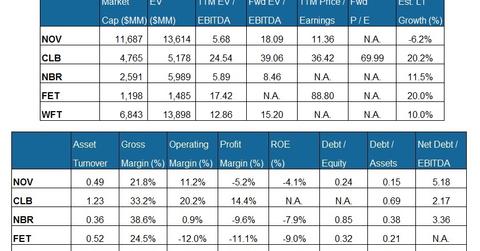
NOV’s enterprise value, when scaled by trailing-12-month adjusted EBITDA, is lower than the peer average.
Apr. 9 2016, Updated 11:07 p.m. ET

Comparable company analysis
National Oilwell Varco (NOV) is the largest company by market capitalization among our selected set of oilfield services and equipment (or OFS) companies. It’s followed by Weatherford International (WFT). Forum Energy Technologies (FET) is the smallest of the lot by market capitalization.
EV-to-EBITDA
National Oilwell Varco’s EV (enterprise value), when scaled by trailing-12-month adjusted EBITDA (earnings before interest, tax, depreciation, and amortization), is lower than the peer average. Adjusted EBITDA excludes extraordinary charges such as asset impairments and restructuring, which we discussed earlier in the series.
Core Laboratories (CLB) has the highest trailing-12-month EV-to-EBITDA multiple in our group. National Oilwell Varco makes up 0.06% of the SPDR S&P 500 ETF (SPY).
Forward EV-to-EBITDA is a useful metric for gauging relative valuation. NOV’s forward EV-to-EBITDA multiple expansion versus its adjusted trailing-12-month EV-to-EBITDA is higher than the peer average. This is because the expected fall in NOV’s adjusted operating earnings in 2016 is more extreme compared to the expected falls of its peers. This also explains NOV’s current low EV-to-EBITDA multiple.
Debt levels
National Oilwell Varco’s net debt-to-EBITDA multiple is higher than the peer average. A higher multiple could indicate insufficient cash to repay debt. This is concerning, particularly when crude oil prices are falling. CLB’s net debt-to-EBITDA ratio is the lowest in the peer group.
For a comparative analysis of the top OFS companies, read Market Realists’ article Which Oilfield Service Companies Can Break the Jinx?
Price-to-earnings
National Oilwell Varco’s valuation, expressed as a trailing-12-month price-to-earnings (or PE) multiple of 11.3x, is lower than the peer average. Its forward PE multiple, like some of its peers, is not available, reflecting analysts’ expectations of negative earnings over the next four quarters.
Analysts also expect a 6.2% earnings fall for National Oilwell Varco in the next three to five years. This could lower NOV’s valuation in the medium to long term.
