Analyzing the European Union’s GDP Composition
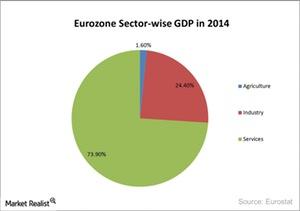
The EU’s (European Union) GDP (gross domestic product) depends on the service sector. The service sector contributes ~73.90% towards the EU’s (EZU) GDP.
Dec. 23 2015, Published 7:47 a.m. ET

Service sector contribution
The EU’s (European Union) GDP (gross domestic product) depends on the service sector. The service sector contributes ~73.90% towards the EU’s (EZU) GDP. Services include software, telecommunication, pharmaceutical, financial institution, and others. SAP (SAP), an IT company, is a leading software solution provider for wider business needs.
Telecommunication companies like Telefonica (TEF) and Orange (ORAN) have a weight of 2.3% and 1.2% in the SPDR EURO STOXX 50 (FEZ). The telecommunication industry accounts for 6.9% of FEZ. Deutsche Bank (DB) and ING Groep (ING) are among the leading financial institutions in the Eurozone. The financial sector has a weight of 22.8% in FEZ. London is the financial capital of the EU. Most of the leading financial institutions stationed their headquarters in London.
Industries and agriculture
The industrial sector contributes 24.4% towards the GDP. Auto manufacturing is one of the prominent businesses in the industrial sector. Auto manufacturers account for 7% in FEZ. Companies like Volkswagon (VLKAY), Daimler (DDAIF), and BMW are the leading auto manufacturers in the Eurozone. Germany accounts for a significant amount of auto manufacturing in the EU.
Agriculture accounts for 1.6% of the GDP. EU members don’t have agricultural-based economies. Agriculture mainly aims to meet the people’s food requirements.
The above graph explains the EU’s GDP composition by sector.
GDP comparison with major economies
Services account for 80.4% of the US GDP. In China, it accounted for 48.2% of the GDP in 2014. Industry accounts for 24.5% of the GDP in the US. It accounts for 42.6% of China’s GDP. In the next part, we’ll analyze the EU’s performance in the last year.
