Analyzing Whole Foods’ Return on Investments
Whole Foods’ net margin was among the highest in its peer group in fiscal 2015. The 12-month trailing net margin for Whole Foods stood at 3.5%.
Nov. 25 2015, Updated 1:53 p.m. ET

Measuring Whole Foods’ returns
In this part of our series, we’ll analyze the most important metrics of Whole Foods Market (WFM) in an effort to gauge for investors their returns on investments. These metrics are ROA (return on assets) and ROE (return on equity).
Return on assets
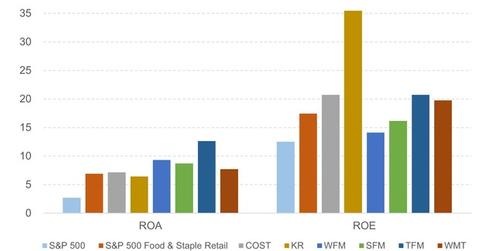
ROA analyzes the managerial efficiency in a company by measuring the profitability of a company relative to its assets. This measure is particularly important in the grocery business, where companies tend to have paper-thin margins. Whole Foods’ net margin was among the highest in its peer group in fiscal 2015. The 12-month trailing net margin for Whole Foods stood at 3.5%—around the double that of Kroger Company (KR) and 1.7 times that of Costco Wholesale Corporation (COST).
How many times the management can turn over a company’s assets is of critical importance. Since 2013, the average asset turnover for Whole Foods’ was around 2.3 times. This has consistently pushed the company’s ROAs over 10%, except in the recent quarter when its ROA was 9.3%. This consistency in ROA indicates that Whole Foods’ has been able to preserve its margins while operating efficiently even amid increased competition.
Return on equity
ROE measures the net profits earned by equity shareholders as a percentage of equity capital invested. Whole Foods’ ROE was the lowest in its peer group and stood at 14% during fiscal 2015. On the other hand, Kroger (KR) had the highest ROE in the peer group at 35%, followed by Costco (COST) and The Fresh Market (TFM), each of which had ROEs of 21%.
We should note that although Whole Foods had a low ROE in fiscal 2015, it had a strong ROA as compared to other grocery chains. The reason behind this low ROE was the low level of debt that the company had on its balance sheet as compared to other peers.
